
Although not a universally accepted definition, the concept of urban pollution refers to the presence or introduction of toxic or harmful substances into cities and urban areas.
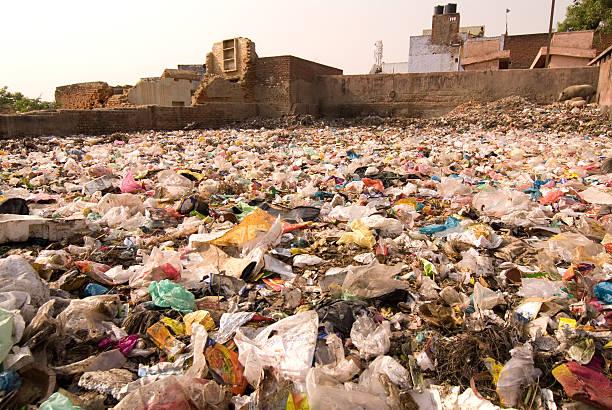
Urban pollution may come from natural sources, but emissions related to human activities are the most harmful. Anthropogenic sources of pollution, such as factories, industries, transportation, and so on, are increasing in cities due to the local concentration of humans and human activities in general. Pollution in cities, for example, is influenced by global environmental threads, such as global warming, and locally-generated environmental challenges, such as waste management, recycling, and light and noise generation.
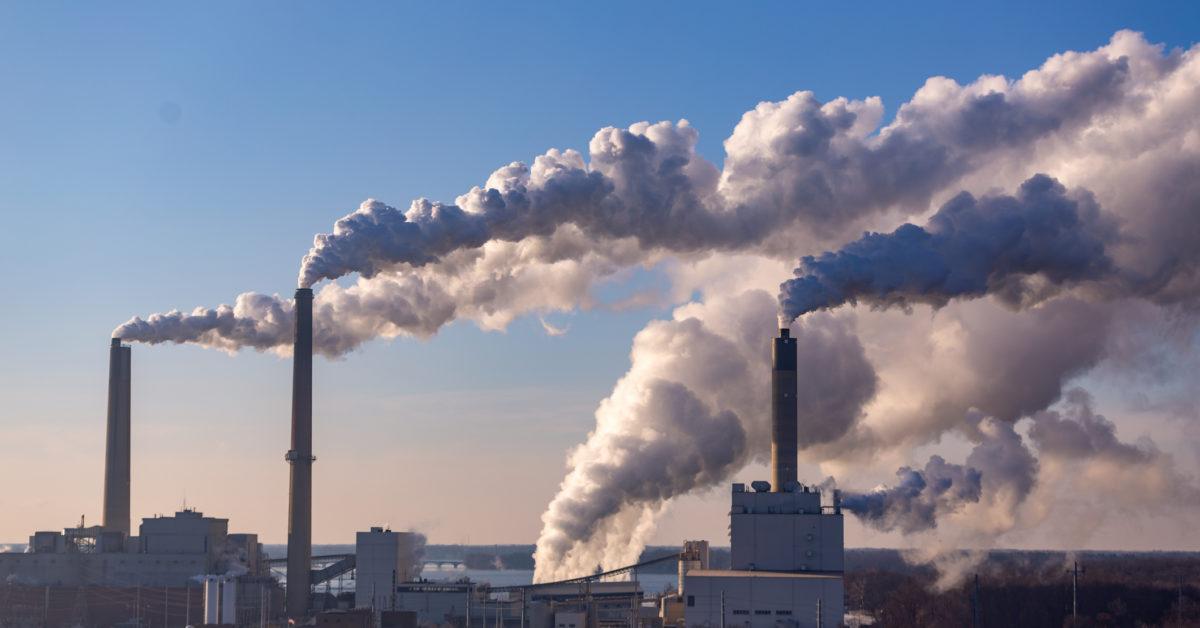
With the rapid growth of the economy and rapid population growth, our society needs abundant resources (e.g. energy, water and food) to sustain our activities. And the result is a growing variety of pollutants. Among the various problems of pollution, air pollution has caused great concern worldwide due to its widespread nature, damage to our environment and potential health hazards to humans. Despite concerns about the emission of air pollutants from anthropogenic sources, our society still relies heavily on fossil fuels for various applications such as electricity generation, transportation, industrial and domestic heating, etc. The obvious consequence of this is the deterioration in our air quality, especially in developing countries. Air pollution has become a public concern in modern metropolises. Numerous studies have been conducted in physics, chemistry, geography and other related fields to investigate the cause and severity of air pollution problems (Seinfeld, 1986). At the same time, the issue of indoor air pollution also aroused the interest of many scientists, as people spend most of their time (> 80%) indoors (Jenkins et al., 1992). Although the time people spend indoors varies according to the season, age, gender, type of work, health status of the occupants, etc., good air quality can protect the health of the occupants and increase the productivity of the workers. Obviously, the indoor air quality should be better than the outdoor air quality due to the protective effect of the buildings and the possible installation of ventilation and air cleaning devices. However, for a combined study of indoor and outdoor air quality in the literature, more than 2/3 people reported higher indoor air pollutant concentrations than outdoor ones (Chen and Zhao, 2011). This underscores the importance of conducting further studies to enhance our understanding of the causes of these problems and related therapeutic measures. Meanwhile, the number of publications on indoor air pollution has increased dramatically in recent decades. Many studies have confirmed that indoor air quality is greatly influenced by outdoor air quality. Therefore, to solve our pollution problems, we must consider the indoor and outdoor environment.
Emissions from vehicles
Emissions from transport vehicles are a major source of pollution, especially in urban areas. They are major sources both of local urban pollutants, such as nitrogen, hydrocarbons and carbon monoxide oxides and global greenhouse emissions such as CO2 (they are also major sources of noise pollution).
The use of vehicles causes not only pollution, but also congestion in urban areas. While congestion is not the focus of this article, many of the comments that follow can be applied not only to emissions of polluting vehicles, but also to congestion and traffic problems. Policy options that reduce vehicle emissions also reduce the frequent congestion problem and therefore generate two sets of social benefits.
Automobiles dominate transportation and travel activities in industrialized countries (except Japan). Automobiles are also a major source of vehicle emissions and a major component of travel-related energy consumption in all OECD countries. They have been a matter of concern by international conferences on air quality and global warming, like the Rio Framework Convention on Climate Change and the UN Conference on Environment and Development.
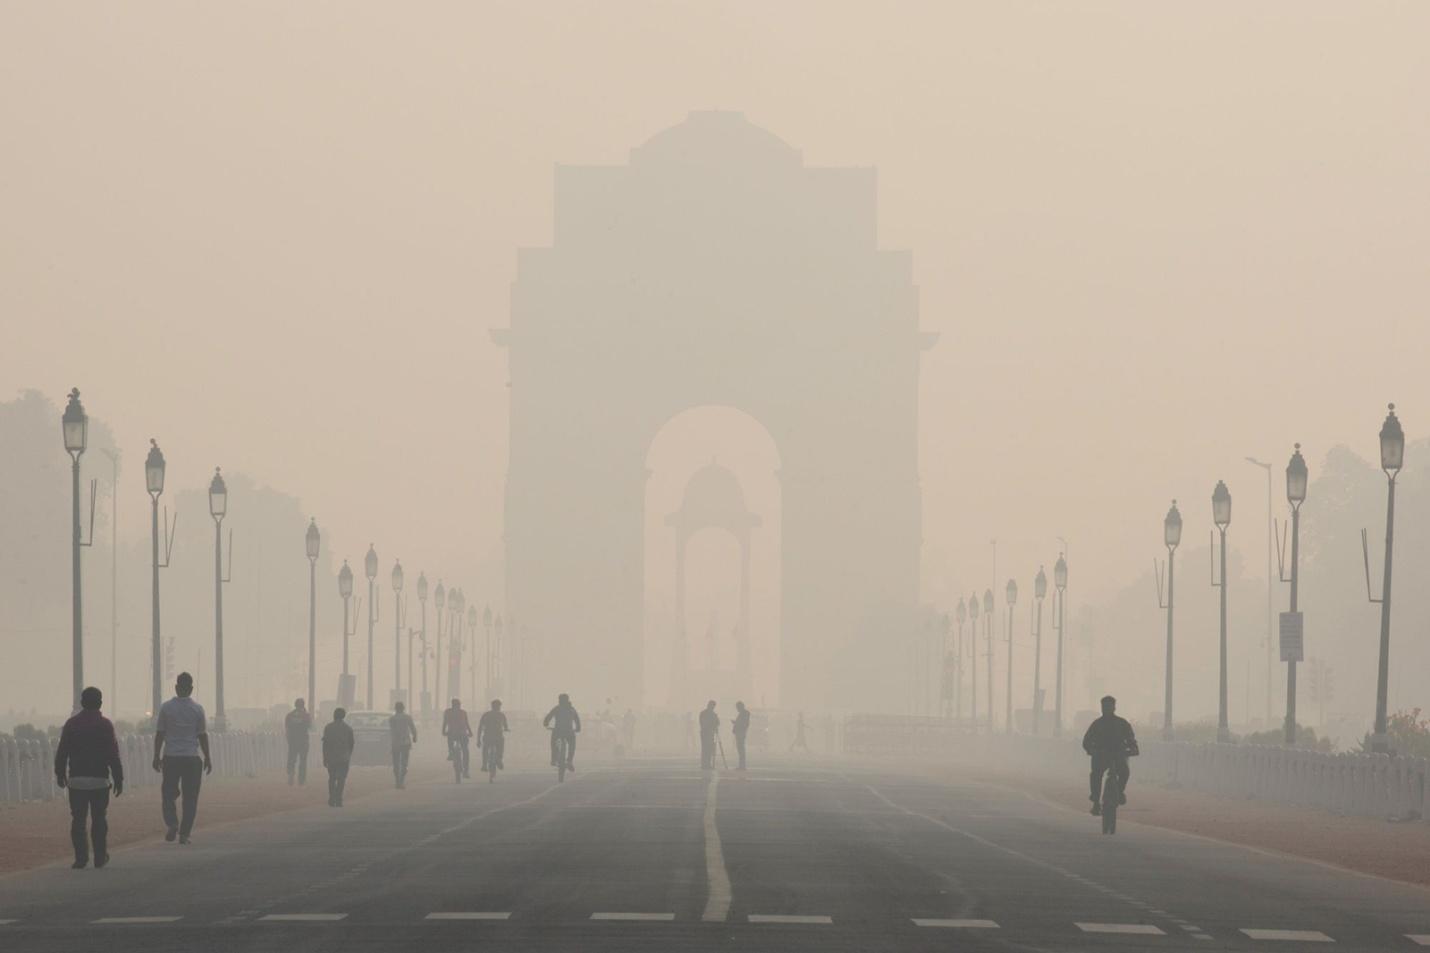
As per a WHO article, more than 80% of individuals living in urban areas who monitor air pollution are exposed to levels of air quality that surpass WHO limits. While all regions of the world are affected, the population of low-income cities is most affected.
According to the latest Urban Air Quality Database, 98% of cities in low- and middle-income countries with more than 100,000 inhabitants do not meet the WHO air quality guidelines. However, in high-income countries, that percentage drops to 56%.
In the last two years, the database – now covering 3000 cities in 103 countries – has almost doubled, with more cities measuring air pollution levels and identifying related health effects.
As urban air quality declines, its occupants are at increased risk for chronic and acute respiratory diseases, including stroke, heart disease, lung cancer, and asthma.
“One of the leading global reasons of increasing disease and death is Air Pollution. The good news is that more cities are moving to monitor air quality, so they have a measure when it comes to improving it,” says Flavia Bustrio, WHO Assistant Director, Family, Women and Children’s Health. “The most vulnerable urban populations are the youngest, the oldest and the poorest which are most affected by air pollutions in urban areas.”
Global urban air pollution trends
Over a five-year period, the WHO was able to compare a total of 795 cities in 67 countries for small and fine particle (PM10 and PM2.5) levels over a period of 2008-2013. PM10 and PM2.5 contain pollutants such as sulfate, nitrates and black carbon, which penetrate deep into the lungs and cardiovascular system, posing the greatest risk to human health. The data was then analysed to develop regional trends.
Major trends observed by WHO during 2008-2013:
Global urban air pollution levels have risen 8% despite improvements in some regions.
In general, urban air pollution levels were lowest among high-income countries, with the lowest prevalence in Europe, the Americas, and the Western Pacific.
The WHO’s Eastern Mediterranean and South-East Asia regions experienced the highest levels of urban air pollution among low and middle-income countries, with annual average levels often exceeding the WHO limit 5-10 times, followed by low-income cities in the West Pacific region.
In the low-income countries of the Eastern Mediterranean and South-East Asia and the West Pacific, urban air pollution levels have risen by more than 5% in more than two-thirds of the cities.
Urban air pollution data in the African region is very low, although the level of particulate matter (PM) in the available data is above average. The database now has PM measurements for twice as many cities as previous versions.
Reducing the toll on human health
Ambient air pollution, made up of high concentrations of small and fine particles, is the biggest environmental threat to health causing more than 3 million premature deaths worldwide each year.
“Air pollution in the urban areas is growing at an alarming rate, wreaking havoc on human health,” states Maria Nira. Maria Nira is the director at WHO, Department of Public Health, Environmental and Social Determination of Health. “At the same time, awareness regarding air pollution is also growing at a fast pace and the number of urban areas that began to observe their air quality has also increased. When air quality improves, global respiratory and cardiovascular related diseases decrease.”
Most sources of out-of-town air pollution are beyond the control of individuals and demand action by cities as well as national and international policy makers to promote clean transportation, more efficient energy production and waste management.
More than half of the cities observed in high-income countries and more than a third in low and middle-income countries have reduced their air pollution levels by more than 5% in five years.
Reducing industrial smokestack emissions, increasing the use of renewable energy sources such as solar and wind and prioritizing faster transportation, walking and cycling networks in the urban areas are a set of available and affordable strategies.
Dr. Carlos Dora from the WHO says that “It becomes vital for urban and national governments to focus on improving urban air quality for improving health and overall development”. “As there will be some improvement in the air quality, health costs related to air pollution will start reducing and workers’ productivity and longevity will start moving upward. Reducing air pollution also brings additional climate bonuses, which could be part of countries’ commitments to a climate treaty.”
During the World Health Assembly, May 23-28, member states will discuss a roadmap for an expanded global response to the adverse health effects of air pollution.
The WHO’s Air Quality Guidelines provide global guidance on thresholds and limitations for major air pollutants that pose a health risk. The guidelines suggest that by reducing particulate matter (PM10) pollution to 70 to 20 micrograms per cubic meter (μg / m), air pollution-related deaths can be reduced by about 15%.
According to the business standard, urban areas produce 70% of the carbon emissions that lead to pollution (due to the displacement of oxygen in the air) and the associated effect on respiration, increase in air pollutants, preventing the earth from freezing at night (greenhouse effects – Reduction in its ability to absorb carbon emissions). Urban pollution has a qualitative impact on quality of life, productivity and human health and kills 7 million people worldwide annually. In a rapidly urbanizing world (currently 4.5 billion to 6.25 billion by 2050), carbon emissions are likely to increase with pollution from the transportation, construction, energy and waste management sectors, unless strict measures are taken in a well-designed manner by multiple stakeholders.
The WHO also recently revised the standards for the Ambient Air Quality (AAQ) Guidelines for PM2.5 (5 mg per cubic meter 10 pcm) and PM 2.10 (20 to 15 mg pcm) prior to the 26th session of the UN Conference of Parties (COP 26) to be held in November 2021 which will definitely consider new standards and global agenda towards Race to Zero (RTZ) Carbon 2050.
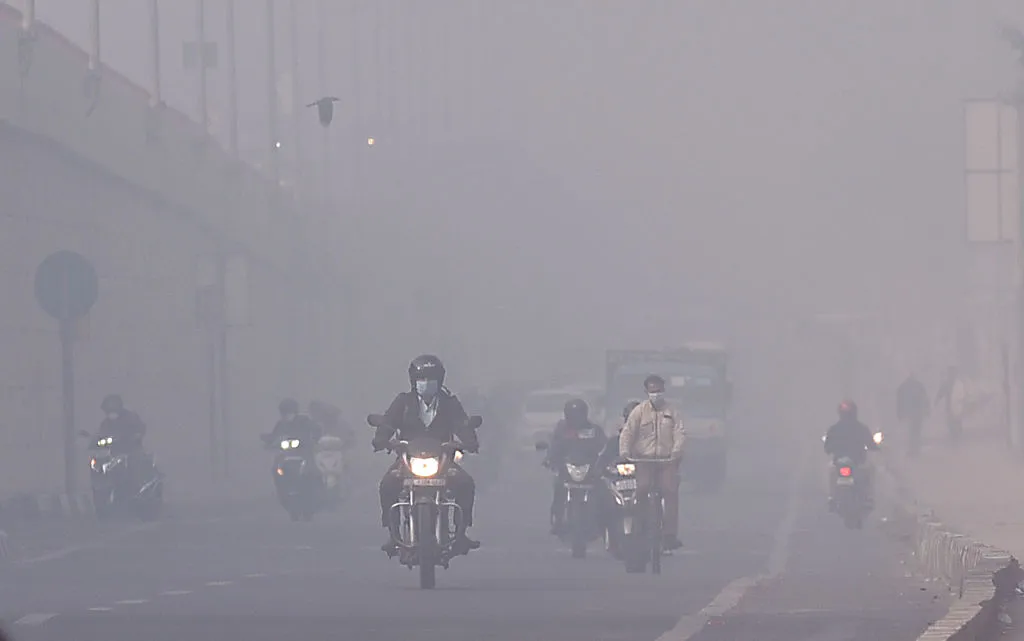
India is also undergoing a transition from a semi-urban (25% +) to an urban majority society, with about half the workforce and only 14% of the GDP for 65% of the population being part of the structural transformation with additional labor in the agricultural sector. Pollution and its associated impact in urban areas with 60-70% carbon emissions and high levels of PM2.5 and 10 is already a concern. India is having 14 of the 20 most polluted cities in the world. (Delhi’s PM2.5 is 17 times safer with Kolkata 9.4, Hyderabad 7 and Chennai 5.4 etc.). In India 1.7 (ICMR etc. 2019) to 2.5 (Harvard 2021) million per annum due to pollution are taking place in urban areas. A large number of people, including Delhi and Mumbai, suffer from respiratory diseases. In 2020, Chennai, Bengaluru, Hyderabad and Lucknow lost about 120,000 lives due to air pollution. In addition, Delhi recorded the highest per capita economic loss (2019) with 13% of the city’s GDP being 14% for Lucknow, 9% for Mumbai, 8% for Hyderabad and 6.8% for Bengaluru and Chennai.
Special attention has been paid to AAQ over the last few years in urban India with multiple strategies focusing on dedicated allocations, national level plans and state / city level actions.
The dedicated allocation for 2021-26 under AVQ and Water and Solid Waste Management (SWM) under XV Finance Commission (FC) for 44 urban agglomerations (covering 1115 towns) in the ratio of 32 and 68% respectively covers Rs 38,196 crore. In addition, about Rs 50,000 crore (for the remaining 3000+ towns) is also dedicated to water and SWM in the ratio of 50% each. In addition, Rs 24,000 crore has been allocated for urban health and wellness centers. Additional Rs 8000 crore has been allocated for incubation of eight towns competitively between the states. It will promote pollution control. Swachh Bharat Mission 02 and Amrut 02 were Launched on October 1, 2021 with an allocation of Rs 4.3 trillion (two points five times more than Phase 1) to focus on water availability and sewer purification to build water plus cities.
The specific programmes/scheme include
(a) National Clean Air Programme (2019) which covers 132 cities,
(b) Climate Smart City Assessment Framework (CSCAF) for awarding cities on 28 indicators under five areas
- Urban planning,
- Green cover/biodiversity,
- Energy efficient green buildings;
- Mobility and air quality and
- Water and waste management (Under CSCAF, 126 cities were evaluated as part of Smart City Mission (SCM) out of which Ahmedabad, Pune, Indore etc. were declared as top performers) and
(c) Streets for People Challenge under SCM (Re-imaging of clean environment friendly public spaces for economic revival, safety and mobility) among 113 cities participating cities States/ city level initiatives cover
- Application of UN-led RTZ Campaign (2050) in 43 major cities of Maharashtra,
- Gujarat and Bihar are also planning RTZ,
- Drive to abolish End of Use Life Vehicles (ELVs) (containing four million ELVs) in Delhi for scraping (September 25, 2021) with identification of seven partners,
- Scientific processing of waste for construction and demolition (c & d) (Ahmedabad, Delhi, Bengaluru etc.),
- The Commission for AQM in NCR (National Capital Region) has issued specific guidelines for strict adherence to C&D Waste Management Rules and uploading compliance on the portal being created in NCR (October 2021),
- Creation of SPV for SWM (Bengaluru) to expedite decentralized waste management
- Specific sites for parking commercial vehicles to make space on roads (MCD-South),
- Innovation Officer for Sarovar Rehabilitation, Water Conservation (Chennai) and
- Blue Green Policy for Mobility and Waste Management (Delhi Master Plan 2041).
Such initiatives alone are not enough without a national urban agenda on pollution control to cover
- Preparation of State Urban Transport Policy for ELV Abolition, Fuel Free Transport, Promotion of Walking and Cycling Space, Rationalization and Restriction of Parking, Promotion of Stage 6 Vehicles / Good Energy of India (as NCTD and Maharashtra).
- Development and rejuvenation of reservoirs,
- Create environment friendly process for building construction and C&D waste
- Reduce waste going to dumping sites through reduction, recycling and reuse with round economy,
- Tree planting campaign and tree census and Extensive use of water storage
- Prepare or revise the master plan for blue-green development
- Giving awards on best practices on RTZ 2050 and
- Carry out ULB capacity building on the above activities through training (virtual, hybrid, face to face), technical support and field visits.