
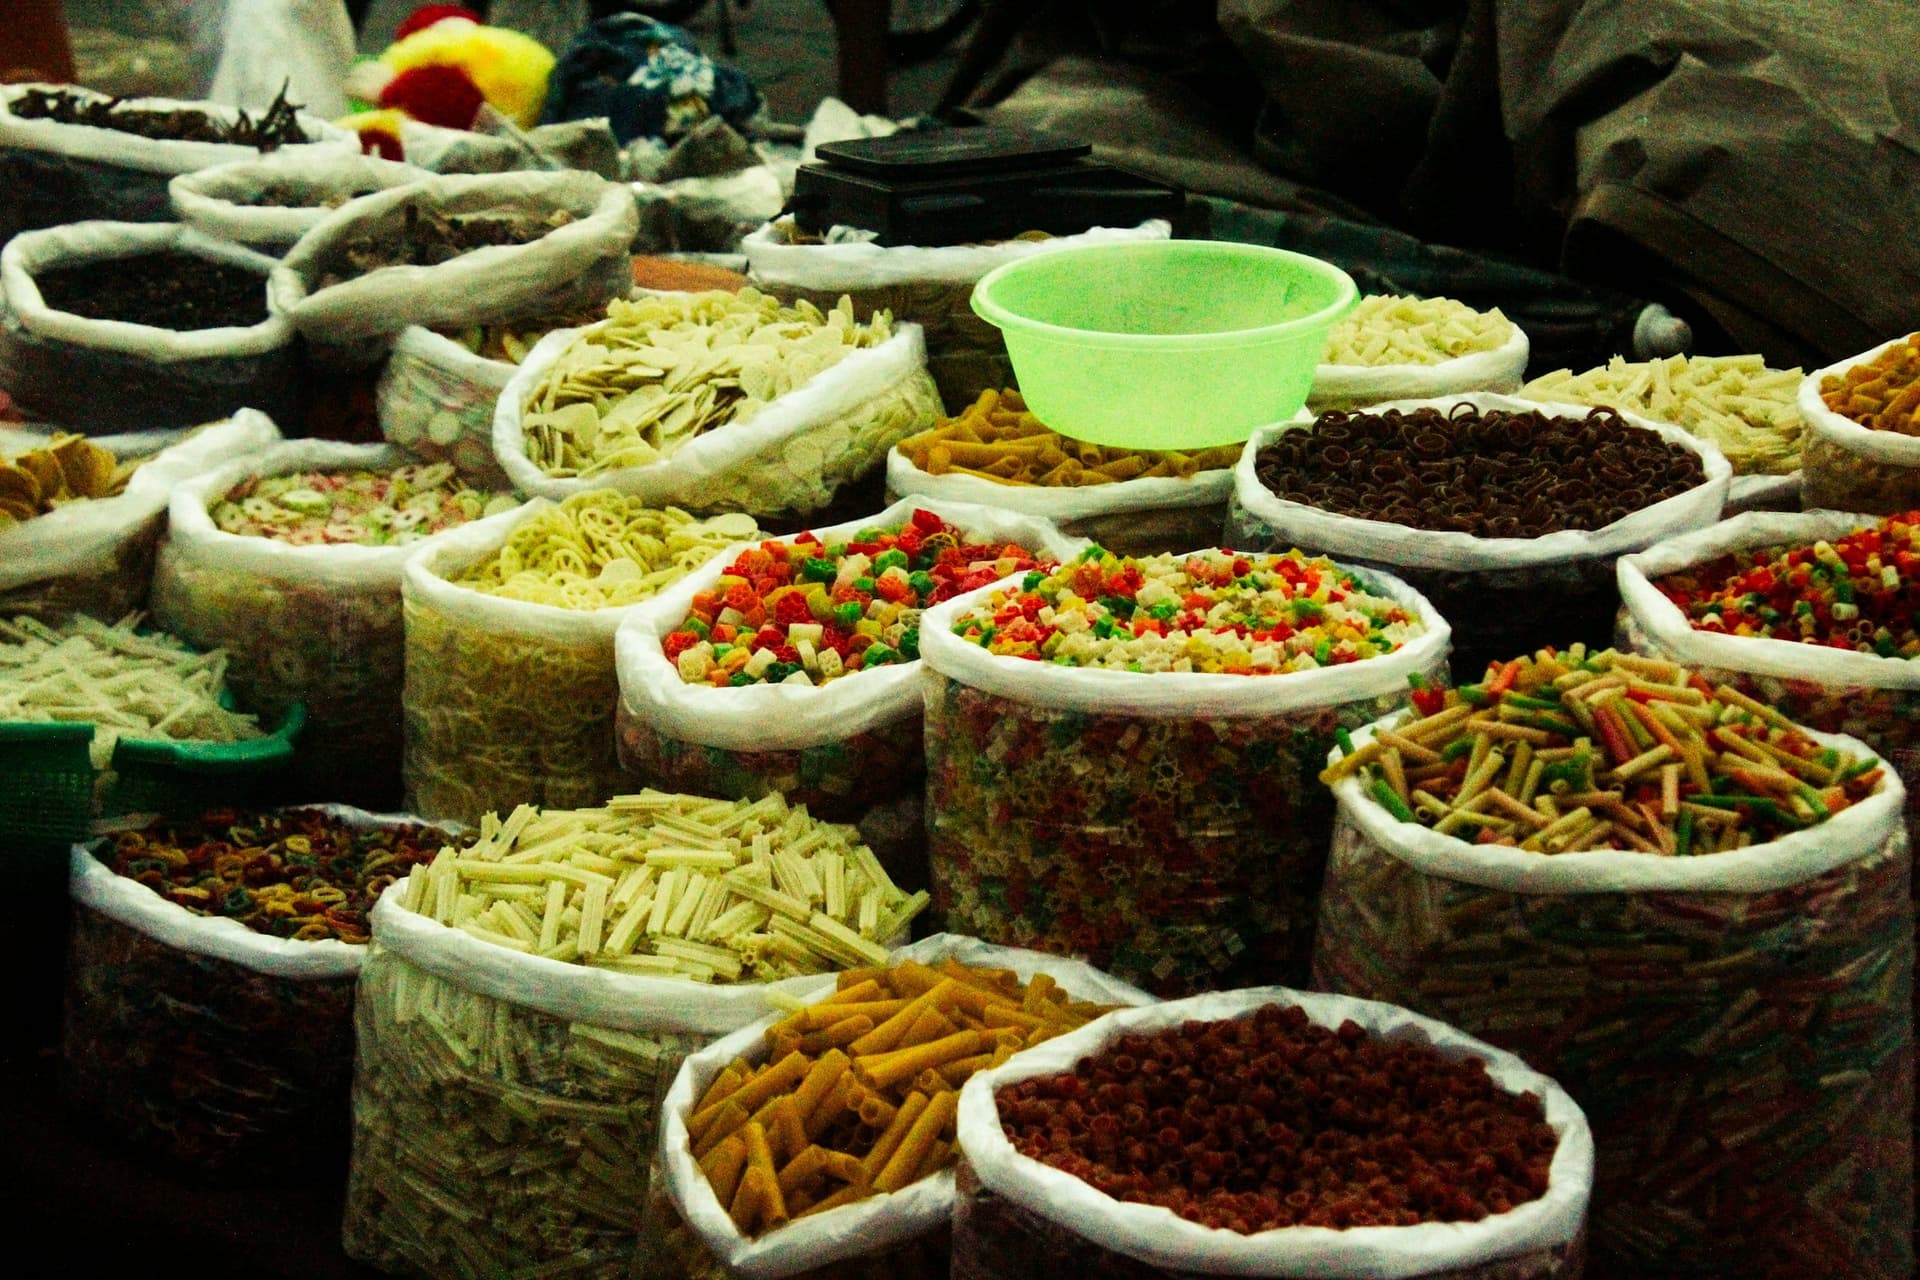
 Photo: Saravanan Narayanan / Unsplash
The Global Hunger Index puts India 105th of 127 countries for 2024, with a score of 27.3, inside the band the report labels 'serious' (Global Hunger Index 2024, Welthungerhilfe and Concern Worldwide). It's easy to read a hunger ranking as a straight count of people going without food. This one isn't.
The score combines four indicators, and only one of them is undernourishment. On that measure, 13.7% of India's population is undernourished. The other three are child measures, and one is stark: child wasting stands at 18.7%, which the 2024 report describes as the highest rate of any country in the index. So the ranking is measuring something broader than hunger as most people picture it. It's measuring whether children are growing.
India's rank on the 2024 Global Hunger Index (score 27.3, 'serious')
Source · Global Hunger Index 2024 (Welthungerhilfe & Concern Worldwide)
India's government has rejected the GHI for years, calling it a flawed measure that leans too heavily on child-health variables. The Ministry of Women and Child Development says its own Poshan Tracker records child wasting consistently below 7.2%, against the index's 18.7%, and it questions the small sample behind the undernourishment figure (Government of India, as reported by Swarajya, 2023, reiterated for 2024).
We're not going to pretend that argument away. We use the GHI as one data point, not the whole case, which is why the rest of this piece leans on figures the government itself publishes or doesn't contest.
A staple kit answers the calorie problem first, because that's the wall in front of the family; diet quality is the gap it only starts to close.
The reason child wasting sits inside a hunger index is that it catches something a food-availability count misses: whether a child is getting enough of the right things to grow. India's own survey puts the numbers plainly. Among children under five, 35.5% are stunted, 19.3% are wasted and 32.1% are underweight (National Family Health Survey-5, IIPS / Ministry of Health and Family Welfare, 2019-21).
Stunting is the slow damage of a poor diet over years. Wasting is acute and recent. Neither shows up as an empty market or a grain shortage. It's diet quality, not just calorie quantity, and that distinction runs through everything below.
Here is the part that reframes the problem. A healthy diet in India costs about 3.07 PPP dollars per person per day, among the lowest costs in the region (FAO Cost and Affordability of a Healthy Diet indicators / World Bank Food Prices for Nutrition, 2024 update, data for 2022). And yet in 2022, 55.6% of Indians, roughly 790 million people, could not afford one (FAO, IFAD, UNICEF, WFP and WHO, State of Food Security and Nutrition in the World 2024).
The constraint isn't the price of food. It's income. There is a real improvement buried in that figure, down from 69.5% in 2017, but 790 million is still most of the country. And most of those households run on daily wages: around 90% of India's workforce is informal, with no written contract and no paid leave to fall back on (WIEGO, 2020). A lost workday and a missed meal are the same event.
of Indians could not afford a healthy diet in 2022 (about 790 million people)
Source · FAO, IFAD, UNICEF, WFP & WHO: SOFI 2024
National numbers stay abstract until you stand in one neighbourhood. In a study of a South Delhi resettlement colony, Dr Ambedkar Nagar, 77.2% of 250 surveyed households were food-insecure, and 28% were moderately-to-severely so, on an average income of ₹9,784 a month (Agarwal et al., 2014).
That is a single-colony study, not a Delhi-wide rate, and we cite it that way. We use it because it describes the kind of neighbourhood Project Seva actually works in, not because it stands in for the city. When three-quarters of a settlement can't reliably keep food on the table, calorie quantity is the first wall. Diet quality is the one behind it.
of households food-insecure in a South Delhi resettlement colony (illustrative, not a Delhi-wide rate)
Source · Agarwal et al., 2014 (peer-reviewed, PMC)
A Seva ration kit is rice or wheat flour, dal and oil, with salt and sugar where a household needs them: the base of a North Indian kitchen. It's honest, specific work. To date the organisation has distributed 65+ tonnes of food grains to 6,500+ families (Pledge A Smile Foundation records, confirmed September 2026). What that kit reliably buys is calories, the month's cushion that keeps a lost workday from becoming a skipped dinner.
What it only partly reaches is the thing the hunger index is really measuring: diet quality, the vegetables, eggs, fruit and dairy that keep a child from wasting or stunting. We'd rather be clear about that seam than paper over it. A staple kit answers the calorie problem first, because that's the wall in front of the family. The diet-quality gap is real, we know where it sits, and closing it is a longer piece of work than a bag of grain.
food grains distributed through Project Seva to date
Source · Pledge A Smile Foundation records, confirmed September 2026
- 1Global Hunger Index 2024 (Welthungerhilfe & Concern Worldwide), India country page: rank 105/127, score 27.3, 13.7% undernourished, 18.7% child wasting Link
- 2FAO, IFAD, UNICEF, WFP & WHO, SOFI 2024, reported for India by Down To Earth: 55.6% (~790 million) unable to afford a healthy diet in 2022, down from 69.5% in 2017 Link
- 3FAO Cost and Affordability of a Healthy Diet (CoAHD) indicators / World Bank 'Food Prices for Nutrition' DataHub: 3.07 PPP dollars per person per day (2024 update, data for 2022) Link
- 4Agarwal et al., 'Prevalence of Household-level Food Insecurity and Its Determinants in an Urban Resettlement Colony in North India' (peer-reviewed, PMC), 2014: 77.2% of 250 households food-insecure, average income ₹9,784/month Link
- 5National Family Health Survey-5 (NFHS-5), IIPS / Ministry of Health and Family Welfare, via Observer Research Foundation, 2019-21: under-5 stunting 35.5%, wasting 19.3%, underweight 32.1% Link
- 6Government of India / Ministry of Women and Child Development statement disputing the GHI methodology, as reported by Swarajya, 2023 (reiterated for 2024): Poshan Tracker child wasting cited below 7.2% vs GHI 18.7% Link
- 7WIEGO Statistical Brief (Raveendran & Vanek), drawing on NSS/PLFS and ILO definitions, 2020: ~90% of India's workers in informal employment Link
- 8Pledge A Smile Foundation records, confirmed September 2026: Project Seva kit contents, 65+ tonnes of food grains and 6,500+ families to date
The numbers are real.
So is the need.